Regional Market Summary Q1 2022

Slow Progress

Written by Dr. Kenneth A. Kriz, Distinguished Professor of Public Administration, University of Illinois

The first quarter of 2022 saw slow progress in the economy. The previous quarter had been up and down, first the continuation of a strong economic recovery that started in the second half of 2020, then a retrenchment in the face of the Omicron COVID-19 variant. In the first quarter, the combined pressures of rising inflation, increasing interest rates and concerns over fiscal drag coming from the inability of the Biden administration to pass large legislative packages caused a significant drag on the economy. This drag overwhelmed the wide-scale reopening of the economy after the Omicron variant proved to be less severe than feared.

Real economic growth at the national level (measured by Real Gross Domestic Product (GDP) was a negative 1.4% in the first quarter. The economy shrank in large part due to three factors, as shown in Figure 1. Those were the spending down of inventories, which accounted for a decline of 0.86% in GDP, a lower level of exports, likely caused by a weak world economy as many regions struggled far more with the Omicron variant (-0.68% contribution to GDP growth), and most significantly a strong growth in imports (contributing a large 2.53% decline in GDP growth). The imports number, while producing a drag on GDP in the fourth quarter, could also be seen as a sign of economic strength. Historically, strong imports – especially in the goods sector where this growth was seen in Q4 – have indicated a strong domestic economy as this reflects strong consumer demand. Also, the parts of the economy that represent consumer spending and business investment contributed over 3% to GDP growth, suggesting underlying strength in the economy. Looking forward, an average of “nowcasts” from various forecasters that we track indicates that real GDP growth will be around 2.5% in the first quarter of 2022, returning back to the trend growth rate of the decade prior to the COVID pandemic.


Components of GDP growth

Figure 1. Source: U.S. Bureau of Economic Analysis.


Payroll employment is beginning to diverge between the nation and the region

On a national level, the labor market continued its slow recovery (Figure 2). Payroll employment at the national level increased by 1.1% during the first quarter. This was down slightly from 1.3% growth in the fourth quarter 2021. Employment growth slowed more substantially for the Quad Cities region, from 1.5% in Q4 2021 to 0.4% in Q1 2022. This should be a concern for the region. Nationally, concerns have been raised about uneven regional growth during the end of 2021 and beginning of 2022. These concerns are apparent in the payroll employment data.

Figure 2. Source: U.S. Bureau of Labor Statistics.


Unemployment rates continued to fall during Q1 2022 but fell faster nationally

Unemployment rates also demonstrate evidence of a growing divergence between national and regional labor market conditions. Rates improved both nationally and regionally in the past two quarters (Figure 3). But the rate has fallen relatively more quickly at the national level. National unemployment rates are now below where they were in March 2020, whereas the rate in the Quad Cities region is still slightly above the earlier mark.

Figure 3. Source: U.S. Bureau of Labor Statistics. Note that the Quad Cities refers to the Davenport-Rock Island-Moline Metropolitan Statistical Area.


Quad Cities return-to-normal index rose during Q1 2022 after stagnating in the previous quarter

Our “Return to Normal Index” shows signs of strength in the regional economy. After moving sideways during the fall and early winter, the Quad Cities economy picked up pace during early 2022 (Figure 4). The index rose fairly steadily from January 1 to mid-March, then dropped a bit at the end of March. We will have to assess in the next report whether this is a break in trend or a blip.

Figure 4. Source Data from Opportunity Insights and the U.S. Bureau of Labor Statistics. Calculations by author,


Expected inflation rates rose during 2021 and diverged in their growth rates

Strong levels of uncertainty remain regarding the path forward in the economy. The consensus of economic forecasters in the Survey of Professional Forecasters is now that the economy will grow at a rate similar to long-run historical trends throughout 2022 and 2023. The “point estimate” of growth has been revised downward from 3.7% real GDP growth in 2022 from the first quarter report to 2.5% in the second quarter report. The variance of the estimates remains high, with significant numbers of professional forecasters seeing a risk of recession in 2022 or 2023. The consensus inflation estimate for 2022 was revised upward once again in the most recent report. The estimate is now 6.1% for the Headline Consumer Price Index and 4.1% for the less volatile Core Personal Consumption Expenditures Deflator.

As we have noted for over a year, there are many uncertainties regarding the path of the economic expansion. Inflation remains a concern, not only in the short-run but the longer-run persistence of inflation. This can be measured through the concept of “inflation expectations,” which measures the level that households and businesses expect inflation rates to be at in the next few years. There are many ways to measure expectations, some using surveys and some using data from the financial markets. Looking at this data, we note that while expected inflation has risen steadily from the start of 2020, one-year expected inflation from survey data (in this case the New York Federal Reserve Bank’s Survey of Consumer Expectations) began to grow substantially in mid-2021 (Figure 5). It reached a peak just under 6.6% in March but fell somewhat in April. Three-year expected inflation from the NY Fed survey did not see the rapid growth in the summer of 2021 and actually fell during the fall and early winter. It began to grow again in early 2022. Five-year expected inflation derived from the prices of inflation-adjusted and non-inflation-adjusted Treasury securities has moved up more slowly but steadily. It stands at 3.32% in April, about seventy basis points (0.7%) less than the three-year expectation and three hundred basis points less than the one-year survey expected rate. Economists will be concerned that inflation expectations do not increase dramatically, as this tends to foreshadow changes in behavior that amplify inflation trends.

Figure 5. Sources: Survey of Consumer Expectations, © 2013-2022 Federal Reserve Bank of New York (FRBNY), Federal Reserve Bank of Cleveland, 5-Year Expected Inflation [EXPINF5YR], retrieved from FRED, Federal Reserve Bank of St. Louis; https://fred.stlouisfed.org/series/EXPINF5YR, May 15, 2022.

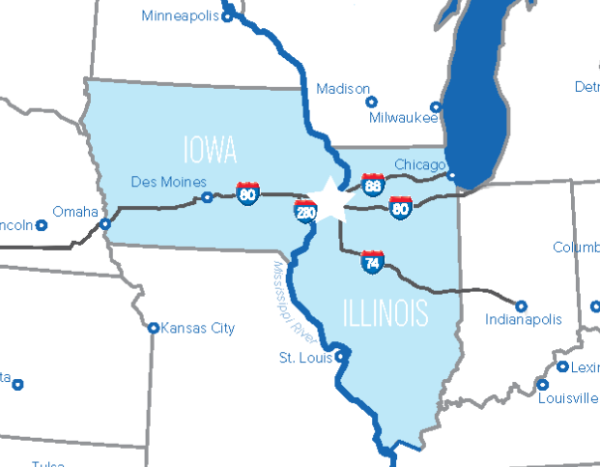
Map of the Quad Cities region
The heart of the Midwest
QC, That's Where? It's where two states and one mighty Mississippi River are home to a family of communities making the Midwest's future.