Regional Market Summary Q2 2020

Second Quarter Economic Activity Initially Fell Dramatically then Expanded Dramatically Upon Reopening

InfograhicWritten by Dr. Kenneth A. Kriz, Distinguished Professor of Public Administration, University of Illinois

The second quarter of 2020 started in the middle of the exponential growth phase of the SARS-CoV2 (coronavirus) pandemic in the US. The nation had just become the focal point of the battle to fight the virus, with confirmed COVID cases passing other countries with earlier outbreaks such as China, Iran, and Italy. The governors of several states (including Illinois) had issued “stay-at-home” or “shelter-in-place” orders and ordered non-essential businesses closed. During the quarter, daily confirmed cases grew dramatically, then fell as mitigation efforts took hold. Economic activity initially fell dramatically as the nation locked down, then expanded dramatically in response to reopening.

Overall, the national economy contracted during the second quarter by nearly one-third on an annualized basis. This economic contraction was unprecedented in history. Though the economy had fallen by similar magnitudes in depressions like the Great Depression, that contraction took years whereas the US economy literally fell off a cliff in the first half of 2020 (Figure 1).

Figure 1. Source: U.S. Bureau of Economic Analysis; seasonally adjusted at an annualized rate.


Economic Contraction across Industries

The contraction hit all major industries, including most notably arts, recreation, accommodation, and food services. Services were generally the hardest hit industries, but transportation and warehousing and durable goods manufacturing (key industries in the Quad Cities region) fell by 65% and 43% respectively. Another key industry for the region, professional and business services, fell by 30%. Economic losses were broad-based and large.

FIGURE 2. ECONOMIC CONTRACTION ACROSS INDUSTRIES.

Source: U.S. Bureau of Economic Analysis


Illinois and Iowa Economies Fall off a Cliff

Regionally, output in both Iowa and Illinois fell by 28% and 29%, respectively in the second quarter. Illinois had a slightly larger drop in both the first and second quarters, likely due to higher virus numbers and more stringent mitigation measures. Industry results for the region were similar to the national pattern, with personal and business services, transportation, and durable goods manufacturing realizing larger losses than other sectors.

FIGURE 3. ILLINOIS AND IOWA ECONOMIES FALL OFF A CLIFF.

Source: U.S. Bureau of Economic Analysis


Unemployment Rates Rise Dramatically then Fall Slowly in the Nation and Regionally

The labor market both nationally and regionally suffered during the second quarter. Unemployment reached 14.7% nationally during April, falling to 11.1% in June. Illinois had much higher rates of unemployment, and Iowa lower. Some of these differences were due to structural differences in the economy (Iowa almost always has a lower unemployment rate than Illinois and the nation as a whole), some were due to a more stringent set of mitigation actions taken by Illinois. In the metropolitan area, unemployment mirrored the nation, with rates of 15.3% in April and 11.5% in June. The metropolitan area lost 10.7% of its nonfarm payroll jobs in April, recovering about one-third of that by June. 

FIGURE 4. UNEMPLOYMENT RATES RISE DRAMATICALLY THEN FALL SLOWLY IN THE NATION AND REGIONALLY.

Source: U.S. Bureau of Labor Statistics. Note that the Quad Cities refers to the Davenport-Rock Island-Moline Metropolitan Statistical Area.


Quad Cities Return to Normal Index Shows Dramatic Fall in March, then Stabilization and a Slow Rise in Economic Activity in Late April-June

The “fast drop, slow recovery” idea plays out when looking at data from the Quad Cities region. We calculate an index for regions showing how well their economies are recovering from the COVID-induced recession. It is called our “Return to Normal” index and is comprised of 4 “high frequency” time series of economic activity (high frequency means that the data is available more frequently than traditional economic indicators that are released monthly, quarterly, or semi-annually). The idea for this index came from work on developing regional economic indices done by the Federal Reserve Banks of Chicago, Philadelphia, and St. Louis. Our four high-frequency indicators are the Dallas Federal Reserve Mobility and Engagement Index, an index of individual’s mobility in visiting retail, recreation, and other venues versus staying home, taken from cell phone data; Earnest Research Aggregate Spending data, taken from credit card transactions processed by many different credit card companies; Unemployment claims, obtained from the U.S. Bureau of Labor Statistics; and Womply’s All Merchants Open index, a measure of how many small businesses are open in a given week (the last two of these indicators are available through Opportunity Insights Economic Tracker). We combine these indicators into a single index using a technique called dynamic factor analysis. This technique has been used by many economists at the institutions mentioned earlier to derive indices of economic activity.

The region experienced a strong loss in economic activity in April below its pre-COVID baseline (calculated as the level of activity in the first week of March when COVID cases began to increase dramatically). The worst of the economic crisis occurred the second week of April and the nation recovered slowly during the rest of the quarter. By the end of June, the regional economy was estimated to have recovered about 62% of the loss it experienced during the early weeks of COVID. Part of this recovery was likely due to the large stimulus received in the region. A recent Quad-City Times article reported that businesses in the region received between $312 million and $593 million in Paycheck Protection Program loans, and we calculate that the region received around $300 million in stimulus checks.

FIGURE 5. QUAD CITIES RETURN TO NORMAL INDEX SHOWS DRAMATIC FALL IN MARCH, THEN STABILIZATION AND A SLOW RISE IN ECONOMIC ACTIVITY IN LATE APRIL-JUNE.

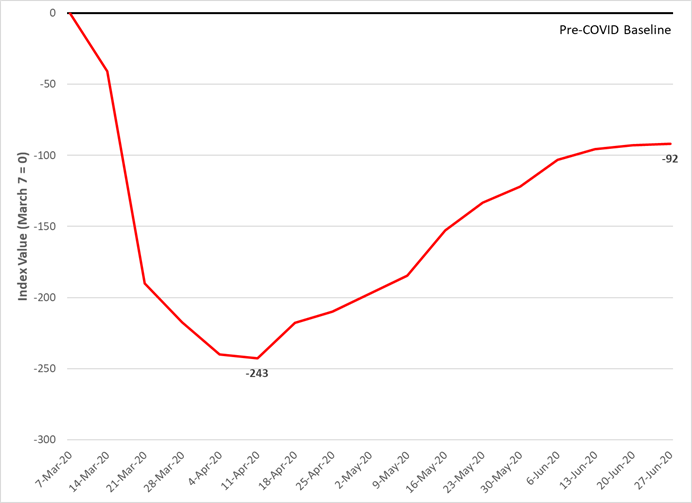
Source Data from Opportunity Insights Economic Tracker,  the Dallas Federal Reserve Bank and Earnest Research, Inc. Calculations by author

As the region moved into the third quarter, expectations were high for a further economic recovery. However, caution regarding the path of the virus, prospects for vaccines or therapeutics for patients, and a further economic stimulus from Washington weighed on these expectations. Most economists expect a strong rebound in the third quarter, but the magnitude of this is yet undetermined.

QC, That's Where?
A Connection to the World!

The QC is the heart of the Midwest, connected by one of the world’s most renowned rivers, the Mississippi and the regional towns it gave birth to over the centuries.

Five major cities make up the Quad Cities metro: Bettendorf and Davenport Iowa, East Moline, Moline and Rock Island Illinois. The entire QC is a family of communities in a six-county bi-state region: Clinton, Muscatine and Scott Counties in Iowa & Henry, Mercer and Rock Island Counties in Illinois. It's within a 300-mile radius of 41 million people with close access to major markets: Chicago, Minneapolis-St. Paul, St. Louis, Des Moines, Omaha, Kansas City and Indianapolis.

QC offers an open-minded network and drive that make the region a hub of ambition; with an opportunity to live in a place that’s as genuine as it is quirky, where you can start something and make a difference, and enjoy the well-being of an authentic community along with the freedom of connection to the world. 

map of the Quad Cities Area